Oct 16 2012
Light is an important commodity in real estate: A nice splash of direct sunshine can lift the value of any house or apartment. But sunlight is a housing asset in another way. A healthy dose of it means any given building can use solar power extensively, as a potentially cheaper and more environmentally friendly energy option.
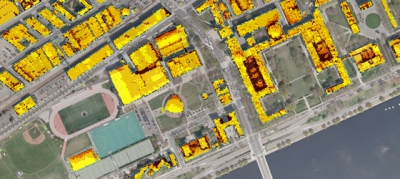
 A screenshot of the Cambridge Solar Map. Note: Video available
Christoph Reinhart’s work is all about that daylight, and its effects: how people respond to light in buildings, and how it can be used more effectively. His approach is heavily empirical. Trained in both physics and architecture, Reinhart has spent years engaged in the close study of buildings and occupant behavior, in the process trying to get engineering and architecture more closely integrated in the design process.
Too often, Reinhart says, people — architects, planners, prospective tenants — visualize a structure soaked in continual sunlight as if it “sits by itself in the desert.” But most buildings do not rest apart from others: Some have access to light that is restricted by other buildings, hills, trees or even microclimates that allow for less sunshine.
Now, as a faculty member in MIT’s Department of Architecture, in the School of Architecture and Planning, Reinhart’s work is evolving, by surveying light in entire communities as well. In early October, Reinhart unveiled a new tool that takes his empirical research to a new kind of breadth: a complete solar radiation map of Cambridge, Mass., which examines the daylight available for every building in the city, and analyzes whether or not solar power would be an economical alternative given current levels of energy use.
Seeing the light with MIT's Christoph Reinhart
“We want to move more into the urban realm,” Reinhart says, “applying our knowledge in energy efficiency and occupant behavior to a whole neighborhood and city.”
From buildings to cities
Reinhart is a native German who received his undergraduate degree in semiconductor physics from the Albert-Ludwigs-Universität in Freiburg, then a master’s degree in semiconductor physics from Simon Fraser University in Vancouver, British Columbia. But when he decided to pursue a PhD, at the Technical University of Karlsruhe, back in Germany, he switched to architecture.
“That’s where I see the decision space for what’s going into a building,” Reinhart says. “And through the lens of architecture, I interact with all these cool people who work on building technologies.”
After receiving his doctorate in 2001, Reinhart worked as a staff scientist at Canada’s National Research Council, taught at McGill University in Montreal, and then joined Harvard University’s Graduate School of Design in 2008. In early 2012, he accepted an offer to join MIT, where he is now a tenured associate professor of building technology.
After dozens of studies and papers, Reinhart’s stock-in-trade has been building sophisticated models of the relationship between the kind of daylight a building receives and the energy consumption of the people who use that building, whether it is a commercial space or a residence. Over the last decade, he has developed commercial tools such as the popular DAYSIM program, used by firms globally, and more recently one called DIVA-for-Rhino, which lets people study the dynamics of a building in minute detail.
“There has been this longstanding habit of just treating people as passive sensors,” Reinhart says. “We not only model a building, but how people behave in it, and what people do — how they create a feedback loop, and what that does to the overall energy being put into the building.”
But in recent years, Reinhart started looking for new intellectual challenges, and thinks he has found a good one in applying his work to larger urban areas.
“We understand individual buildings,” Reinhart explains. “That doesn’t mean better buildings are always being built in the world, but we know how to build very efficient buildings. But as researchers … cities present a huge challenge for us.”
A data point for every hour of the year
The Cambridge Solar Map, as a way of meeting that challenge, incorporates immense amounts of data into a tool that can be used on a laptop computer. In his office, Reinhart is happy to preview the tool in advance of its formal unveiling, which occurred in early October. Each building in Cambridge, viewed from above, consists of a grid of smaller squares, on which varying levels of light intensity are displayed with colors; in turn, each of the small squares is composed of 8,760 data points — one for each hour in the year.
An easy interface then presents users with the bottom-line data they need to know: how much a solar conversion would cost, and how long, given current levels of energy use, that investment would take to pay off.
This particular tool, and others Reinhart and his students are developing for commercial enterprises, all feature interfaces that make financial costs and benefits easy to access.
“In theory, there is a lot of money lying around that people would like to invest in green buildings,” Reinhart says. “But there is a lot of doubt that you get your money back. So we find that this kind of analysis is very welcome.”
Ultimately, Reinhart’s research, and projects such as the Cambridge Solar Map, have multiple audiences. Planners, developers and engineers can benefit from knowing more about daylight — but so can architects, by incorporating empirical light models into their designs. Reinhart thinks the architecture profession — and, ultimately, building occupants — will benefit from this kind of convergence.
“I love design,” Reinhart says, adding: “I think the most relevant research in building science, in this domain, has to be done in a school of architecture. Because the classroom is the lab … the architecture students come with wider questions [about using your own research]. That’s the best thing that can happen to you.”