 By Nidhi DhullReviewed by Lexie CornerUpdated on Aug 28 2024
Spectrophotometers measure the amount of light that can pass through a specimen,1 providing insights into material properties at both atomic and bulk levels, including transmittance, reflectance, and absorption.
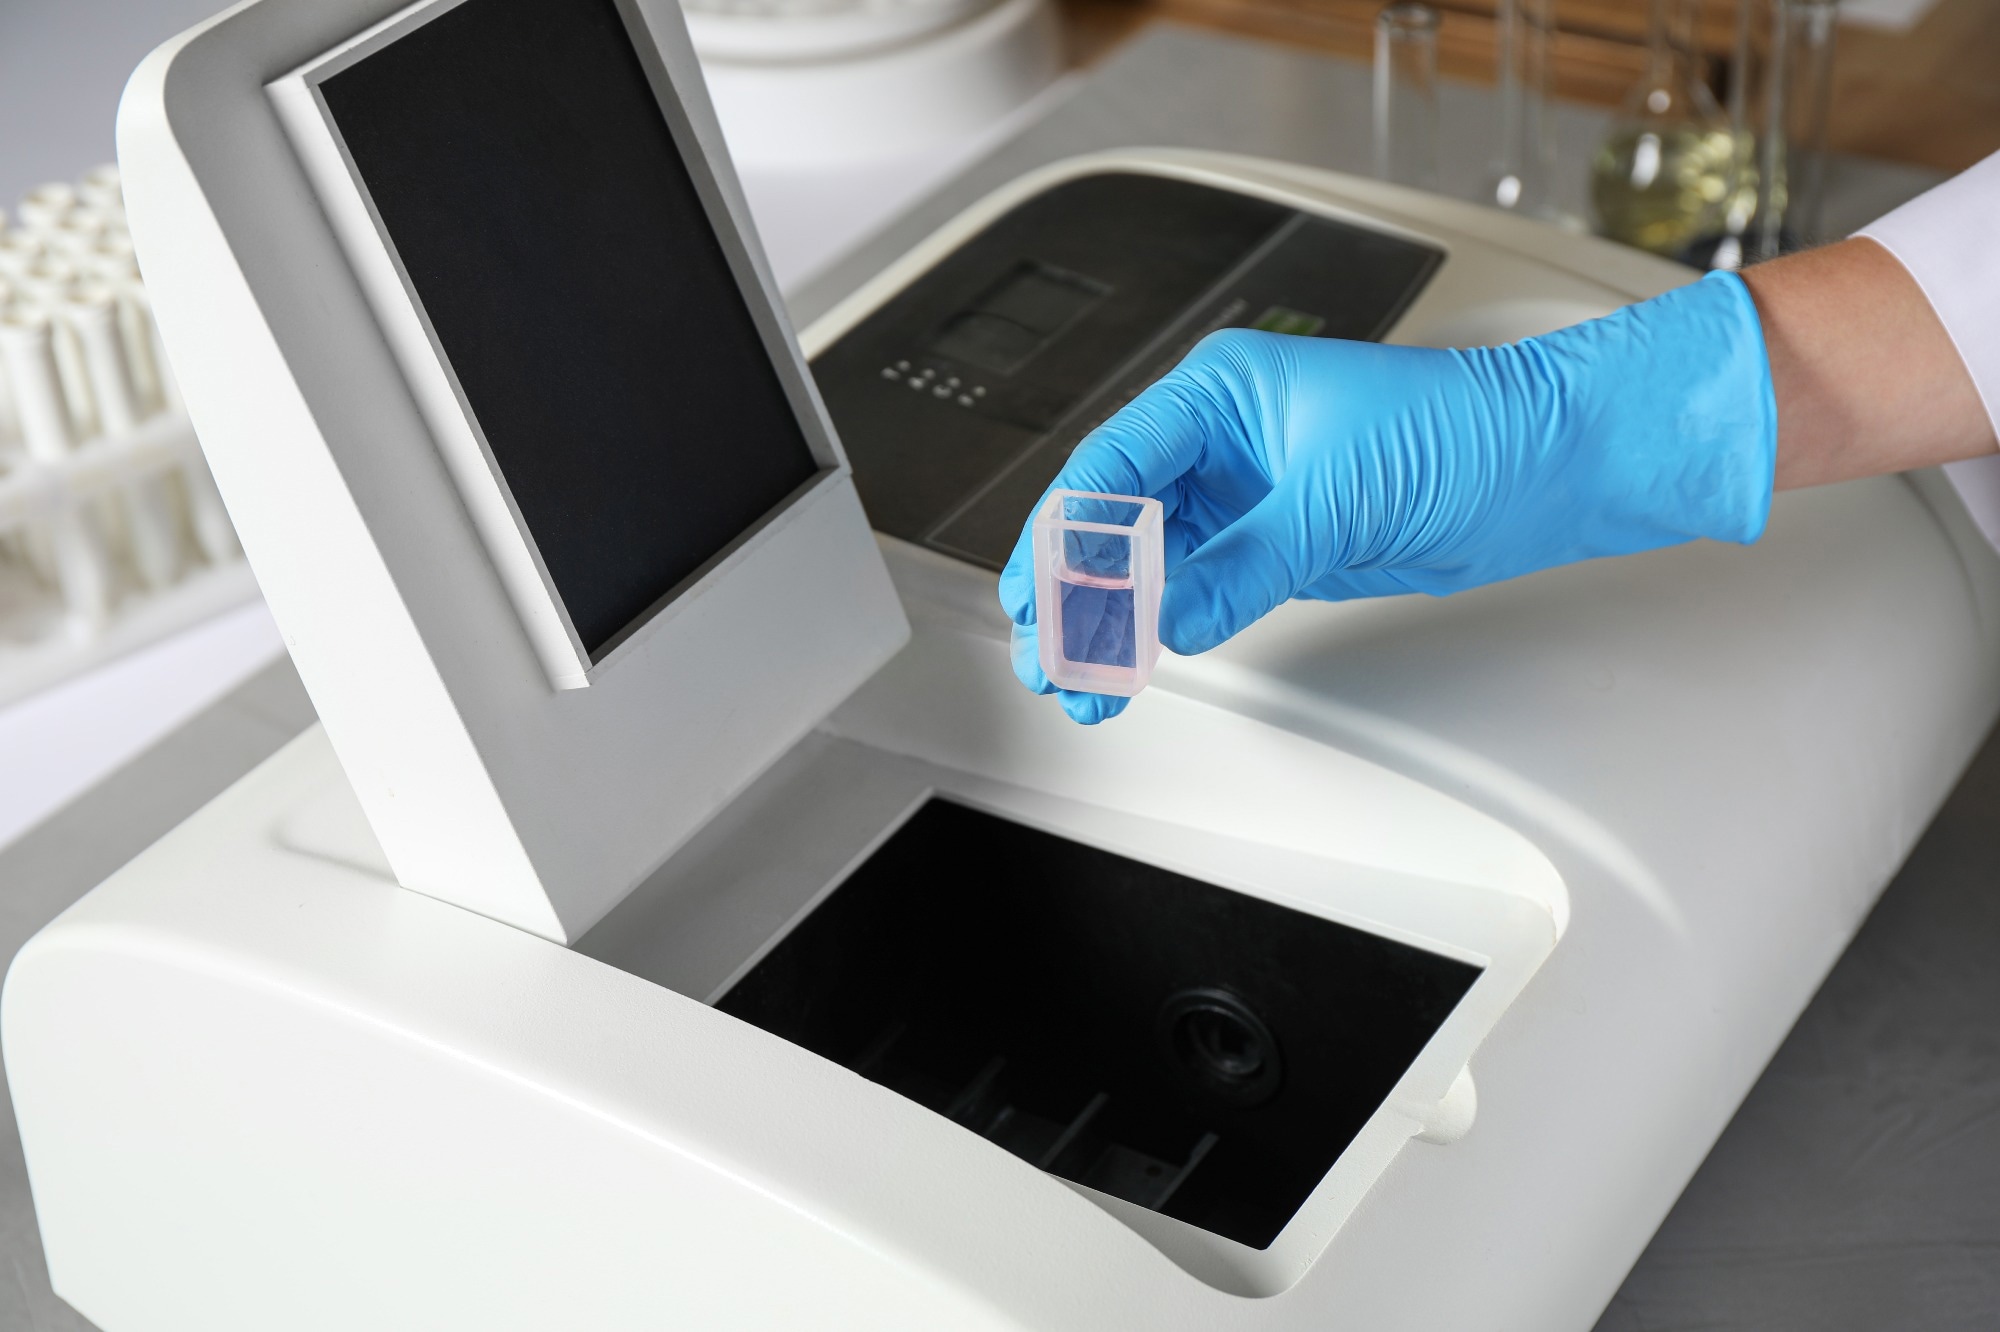
Image Credit: New Africa/Shutterstock.com
These devices work by illuminating a material with light and detecting its response, making them one of the most powerful analytical tools for studying material properties and quantifying chemical species in a sample.2
Spectrophotometers scan the spectrum across a range of wavelengths or monitor different spectrum positions simultaneously, representing the measured quantity as a function of radiant power.3
Essential components of a spectrophotometer include a light source, monochromator, sample holder, photomultiplier, and phototube.1 This article explores the basic principles, types, and applications of spectrophotometers.
How Do Spectrophotometers Work?
Spectrophotometers are analytical devices that measure the transmission, absorption, reflection, and emission behavior of a material or chemical species as a function of wavelength, both qualitatively and quantitatively.3
Inside a spectrophotometer, light from a source is focused on the sample directly or after passing through a monochromator, which separates the light into its component wavelengths.
Light emerging from the sample is passed through a photomultiplier to magnify its intensity and then through a phototube to quantify this light into transmittance values. A clear sample yields 100 % transmittance, while turbid or dense samples show lower transmittance.1
Spectrophotometers help quantify analytes in a sample using Lambert's and Beer's laws. Lambert's law relates light absorbance to the number of molecules of the absorbing substance through which the light passes. In contrast, Beer's law accounts for analyte concentration, light path length, and incident light wavelength to compute the total optical density (OD) due to the target analyte in a sample.1
Multiple molecules in a sample may absorb light at the same wavelengths as the analyte; thus, blank measurements are performed to negate these contributions to absorbance. For accurate analyte quantification, containers holding the blank must have the same light absorption characteristics. Special sample holders called cuvettes are used to analyze liquid samples in spectrophotometers.1
Spectrophotometers offer several advantages as analytical tools. They are rapid, require minimal sample quantities (which can often be recovered), and provide accurate, reliable structural information due to their high selectivity and sensitivity, even in complex mixtures. Additionally, they allow continuous sample monitoring in industrial applications using a computer.3
How does a spectrophotometer work?
Types of Spectrophotometers
Spectrophotometers cover the entire electromagnetic spectrum, from radio waves to gamma rays. Among these, ultraviolet-visible (UV-Vis) and infrared (IR) spectrophotometers are the most common. These measure the transmission, absorption, reflection, and emission behavior of an analyte as a function of wavelength.3
UV-Vis Spectrophotometers
UV-Vis spectrophotometers operate in the wavelength range of 185 nm to 2100 nm. The entire absorption spectrum of a sample is recorded to determine the wavelengths absorbed by an analyte. The transmitted radiation power of the incident beam decreases proportionally to the analyte concentration and the distance it travels through the sample.3
IR Spectrophotometers
IR spectrophotometers are similar to UV-vis spectrophotometers in that they use a light source, sample holder, and detector. However, they employ different components and working principles.
For example, Fourier-transform IR (FTIR) spectrophotometers use an interferometer instead of a monochromator to analyze the radiation absorbed by molecules, exciting their vibrational motion.3
IR spectrophotometers can analyze solid, liquid, and gas samples, provided the molecules are IR active, meaning their molecular dipole moment changes upon absorbing IR radiation. The detector's original output is transformed into a spectrum using Fourier transform mathematics.3
Common Applications
Spectrophotometers have wide-ranging applications in various industries and research fields, including environmental analysis, biomedical sciences, material science, and space exploration. 2,3
They are used in photonics, coatings, pharmaceuticals, instrumentation, remote sensing, metrology, and military applications, advancing process standards, measurement methods, and modeling capabilities.2
Spectrophotometers enable the non-invasive diagnosis of skin diseases and the automated detection of hidden weapons by analyzing the reflectance spectrum of human skin, which contains spectral contributors like water, melanin, and hemoglobin. This high-quality reflectance spectrum allows for the assessment of variability across different populations.2
In biochemistry, spectrophotometers are employed to study enzyme-catalyzed reactions and are widely used in clinical applications for examining blood or tissue samples. Chemists utilize spectrophotometers to determine the molecular structure of compounds, assess purity, detect functional groups, and study decomposition processes.3
Spectrophotometers have become essential tools in advancing thin-film and nanotechnology. They help determine optical properties such as transmittance, refractive index, size, absorption coefficient, and band gap of thin films and nanomaterials for various applications. For example, comprehending the properties of graphene and its derivatives using FTIR spectrophotometers allows their application in future technologies such as solar cells and light-emitting diodes.3
Conclusion and Future Prospects
Spectrophotometers are increasingly influencing various aspects of life. A recent study in Food and Humanity demonstrated the use of FTIR spectrophotometers in the analysis of dairy products, with near and mid-IR spectrum regions being particularly useful for qualitative and quantitative analysis.4
These devices can detect adulterants, contaminants, and toxins in dairy products, offering high throughput, minimal sample preparation, ease of operation, low variable cost, and no need for hazardous chemicals. Chemometric tools used in conjunction with FTIR help prevent food fraud.4
Efforts are ongoing to improve the resolution and detection limits of spectrophotometers and enhance their practical applicability. For instance, a recent study in the IOP Conference Series introduced a portable spectrophotometer to monitor water quality in recirculating aquaculture systems.
Effective water quality management is crucial in aquaculture, as factors like nitrogen, pH, temperature, turbidity, and dissolved oxygen significantly impact aquatic life. Traditional water quality analyses are often time-consuming, but the proposed low-cost, portable wireless spectrophotometer offers rapid and reliable measurements.5
Spectrophotometers are versatile tools capable of analyzing any material that exhibits absorbance, transmittance, reflectance, or emission of radiation. They are vital in advancing research across chemistry, physics, biochemistry, material science, medicine, and chemical engineering. Technological advancements, including miniaturization, are expected to expand their use in various industrial processes further.
Discover More: Design of NIR Process Cells for Process Analytical Technology (PAT)
References and Further Reading
1. Bassiri, E. (2020). Spectrophotometer. Molecular Biology of Life Laboratory. [Online] University of Pennsylvania. Available at: https://www.sas.upenn.edu/labmanuals/biol123/Table_of_Contents_files/8b-EnzymeKinetics-Spec.pdf
2. Corey, P. (2021). Spectrophotometry. National Institute of Standards and Technology, United States. https://www.nist.gov/programs-projects/spectrophotometry
3. Kaflé, BP. (2018). Chemical analysis and material characterization by spectrophotometry. Elsevier. ISBN: 978-0-12-814866-2.
4. Saji, R., Ramani, A., Gandhi, K., Seth, R., Sharma, R. (2024). Application of FTIR spectroscopy in dairy products: a systematic review. Food and Humanity, 100239. DOI: 10.1016/j.foohum.2024.100239, https://www.sciencedirect.com/science/article/pii/S2949824424000144
5. Amijar, MISM., Mohamed Ramli, N., Nurulhuda,K., Abd Aziz, S. (2024). Portable Spectrophotometer for Water Quality Monitoring in Recirculating Aquaculture Systems. IOP Conference Series Earth and Environmental Science. DOI: 10.1088/1755-1315/1359/1/012028, https://iopscience.iop.org/article/10.1088/1755-1315/1359/1/012028
Disclaimer: The views expressed here are those of the author expressed in their private capacity and do not necessarily represent the views of AZoM.com Limited T/A AZoNetwork the owner and operator of this website. This disclaimer forms part of the Terms and conditions of use of this website.