The constraints of the optical metrology instruments selected for process and quality control have to be understood very clearly as Manufacturers of optics and high-precision machined parts exclusively design increasingly detailed specifications and manufacturing tolerances.
In general, the optical resolution of a surface profiler is object-dependent. However, regimes can be defined where the Instrument Transfer Function (ITF) and its optical cutoff capture important metrics about the capability of a specified instrument. This article describes how the ITF relates to other optical transfer functions as well as conventional definitions of optical resolution.
Definitions of Optical Resolution and Optical Transfer Function
The ability to identify the presence of two adjacent source points is associated with the conventional definitions of an optical instrument’s resolution. According to the Rayleigh criterion, the minimum separation is defined as the distance for which the first zero of the point spread function (PSF) of one source point overlaps the maximum of the PSF for the other. The Sparrow criterion is defined by the separation for which the ensuing intensity pattern has no curvature in the center [1]. The Abbe resolution limit is the largest diffraction grating pitch that cannot be detected by the optical system, when approaching the definition of resolution from a different angle. While the Abbe definition corresponds to objects that are Dirac distributions in the spatial frequency domain, the Sparrow and Rayleigh definitions correspond to objects that are Dirac distributions in the object plane. The degree of coherence of the illuminating light affects these distributions, as shown in Table 1 where NA is the image space numerical aperture of the optical system and λ is the wavelength of light.
Table 1. Definitions of lateral resolution of an optical system as a function of the illumination type
| Rayleigh (incoherent) |
Sparrow (coherent) |
Sparrow (incoherent) |
Abbe (coherent) |
Abbe (incoherent) |
| 0.61 λ/NA |
0.73 λ/NA |
0.47 λ/NA |
λ/NA |
0.5 λ/NA |
The spatial frequency cutoff of the optical system is defined by the Abbe resolution when the latter is considered to act as a linear filter on the image frequency content. Linear filtering actually takes place only under specific conditions of object imaging and illumination: fully coherent or incoherent illumination and low-NA. It is the image intensity that is linearly filtered in an incoherent imaging system [2], whereas in the case of a coherent imaging instrument the optical system carries out a linear filtering operation on the amplitude of the optical field. Practical optical systems rarely meet these exact criteria, as in most cases illumination is partially coherent; however, linear filtering is still a useful estimate to understand the expected behavior of a given instrument.
The frequency response of the filtering process [3] is described by the Optical Transfer Function (OTF). Its magnitude, the Modulation Transfer Function (MTF) for coherent and incoherent diffraction-limited optical systems is shown in Figure 1. The spatial frequencies corresponding to sinusoidal object features having the same pitch as the Sparrow and Rayleigh separation limits are also shown in Figure 1.

Figure 1. Theoretical MTF of coherent and incoherent diffraction-limited imaging systems. Spatial frequencies are normalized to ƒs = 2NA/λ.
Resolution in the Context of Surface Height Metrology: The Instrument Transfer Function
The carrier of information in an interferometer, used for surface metrology, is the phase of the light scattered by the object. The circulation of this information via the optical system can also be explained as a linear filtering process under situations more restrictive than for the filtering of intensity or amplitude. For a sinusoidal object of pitch 1/ƒ and depth H, illuminated by a plane wave along the surface normal (coherent illumination) the scalar complex amplitude takes the form of Equation (1) in the plane of the object, where Jp is a Bessel function of the first kind of order p. It was observed that the spatial frequency spectrum of the optical field contains harmonics pƒ, according to the diffraction orders of the grating. Authentic reconstruction of the object amplitude is prevented by the suppression of some of these orders during the imaging process (diffraction angles outside of the imaging NA) thus resulting in a distorted object profile. In this general case, a transfer function cannot be simply defined as the filtering process is inherently object-dependent.
 |
(1) |
 |
(2) |
Equation (2) shows the simplification of the complex amplitude in the limit case where the object height is small compared to the wavelength of light. Coherent filtering by the instrument pupil will either clip or pass the two diffraction orders (case where ƒ is smaller than NA/λ). Any information about the presence of a grating is lost or the object amplitude is ideally reproduced in the image plane. In the first case, measuring the phase of the object amplitude, for instance, using a spatial carrier or phase-shifting technique [4], will then produce the expected profile of the surface. It is observed that the linear filtering of the height information, which is defined by the ITF, is similar to the coherent OTF of the system in this small-object-height coherent regime [5].
All energy-carrying diffraction orders fall within the cutoff of the filter function in a complementary system, in which case the object profile can also be reproduced authentically. This allows relaxing somewhat the requirement of small height modulation for spatial frequencies much smaller than the cutoff.
The formalism of Goodman [2], section 6.5.1, is applied for incoherent illumination to demonstrate that the ITF is similarly given by the incoherent OTF. A component exp (iφ) is first added to Ug, which represents the contribution from the reference leg of the interferometer, and derive the spatial frequency spectrum Gg of the sum, as shown in equation (3).
The autocorrelation of Gg is then computed, the terms in (H/λ)2 are dropped, and multiplied by the autocorrelation of the pupil function, which is by definition the OTF of the system. This is shown in equation (4) where the fact that OTF (ƒ) = OTF (-ƒ) and OTF (0) = 1 were used. Equation 5 shows the final Fourier transformation that produces the intensity distribution in the image plane, where a conventional two-wave interference pattern with a phase describing a sinusoidal surface height variation of depth H x OTF(ƒ) is observed. Thus, Researchers make out the ITF as being identical to the incoherent OTF.
 |
(3) |
 |
(4) |
 |
(5) |
Both incoherent and coherent results outlined above are valid within the approximation of low NA (scalar diffraction) and small object heights. In practice, the ITF of a given instrument will deviate from the theoretical curves due to partial coherence (resulting for example from epi-illumination), detector sampling, pupil apodization and aberrations etc. In this situation, a realistic definition of the resolution limit of a surface profiler is the spatial frequency for which the measured ITF falls to 50%. This is the optical cutoff defined in ISO 25178-604 [6].
ITF and Resolution as a Criterion for Selecting Surface Metrology Instruments
An easy way of comparing the resolution of interferometric surface metrology tools is through the optical cutoff. One should not a priori expect that equivalent resolution is offered by two instruments that provide similar fields of view and camera formats. However, if their optical cutoffs are matched, their resolution will be similar. During evaluation of the overall instrument metrology capability, such as vibration insensitivity, coherent artifacts, reproducibility, repeatability and noise floor etc., other criteria come into action. This optical cutoff is a fundamental selection criterion when matching the resolution of the instrument to a particular requirement, such as when characterizing the waviness of hard drive substrates or the Power Spectral Density of mirrors employed for EUV lithography. To correct the measured parameters in such applications, accurate knowledge of the ITF can additionally be used.
ZYGO's Verifire™ HD Interferometer & Nomad™ Optical Profiler Demos at Photonics West 2016
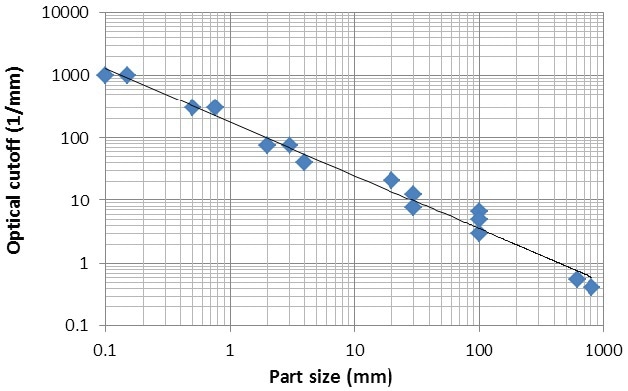
To conclude, the optical cutoff of the coherent and incoherent interference surface profilers shown in Figure 4 as a function of part size is plotted in Figure 3. Almost four orders of magnitude along both the axes are covered by the curve, illustrating the range and flexibility of these instruments for characterizing critical surfaces with sub-Angstrom vertical resolution.

Figure 3. Plot of the optical cutoff of a variety of interference surface profilers as a function of measured field of view.

Figure 4. Images of some of the instruments characterized in Figure 3.
References
[1] R. Barakat, “Application of Apodization to Increase Two-Point Resolution by the Sparrow Criterion. I. Coherent Illumination,” JOSA 52, 276-283 (1962).
[2] J. W. Goodman, Introduction to Fourier optics – 3rd Edition, (Roberts & Company, Greenwood Village, Colorado, 2005).
[3] G. D. Boreman, “Modulation Transfer Function in Optical and Electro-Optical Systems (SPIE press, Washington, 2001).
[4] D. M. Sykora and P. J. de Groot, " Instantaneous measurement Fizeau interferometer with high spatial resolution," Proc. SPIE 8126, 2011.
[5] P. de Groot and X. Colonna de Lega, "Interpreting interferometric height measurements using the instrument transfer function," Proc. FRINGE 2005, W. Osten, Ed., 30-37 (Springer Verlag, Berlin Heidelberg, 2006).
[6] “Geometrical product specification (GPS) – Surface texture: Areal – Part 604: Nominal characteristics of non-contact (coherence scanning interferometric microscopy) instruments,” ISO/WD 25178-604.

This information has been sourced, reviewed and adapted from materials provided by Zygo Corporation.
For more information on this source, please visit Zygo Corporation.