From PittconMay 17 2023Reviewed by Danielle Ellis, B.Sc.
In this interview conducted at Pittcon 2023 in Philadelphia, Pennsylvania, we spoke to Dr. Mustafa Kansiz, Director of Product Management and Marketing at Photothermal Spectroscopy Corp, about O-PTIR, a new and alternative infrared spectroscopy method.
Could you please introduce yourself and your current role at Photothermal Spectroscopy?
My name is Mustafa Kansiz, and I am the director of product management and marketing at Photothermal Spectroscopy Corp. I have been using infrared spectroscopy for over a quarter of a century.
I have a Ph.D. from Monash University in Melbourne, Australia. I have been doing infrared (IR) continuously since the completion of my Ph.D. I have worked in an infrared spectroscopy position in various instrumentation companies in product management roles and also in sales, and I was also an R&D scientist for a while. I was lucky enough to stumble onto this role a few years ago, and I have been here now for just over four years.
What is optical photothermal infrared?
Optical PhotoThermal InfraRed (O-PTIR) is a new and alternative infrared spectroscopy method. Infrared spectroscopy has been around for 100 years and has been done dispersively and with (Fourier-transform infrared spectroscopy) FTIR. There are also emerging (quantum cascade laser) QCL-based imaging techniques.
In 2017 we introduced a novel infrared spectroscopy method – O-PTIR. It still generates infrared spectra and images but does so very differently.
I consider these as direct techniques, where infrared interacts with a sample, and you detect via the infrared light. There are several disadvantages to this approach, which we will get to.
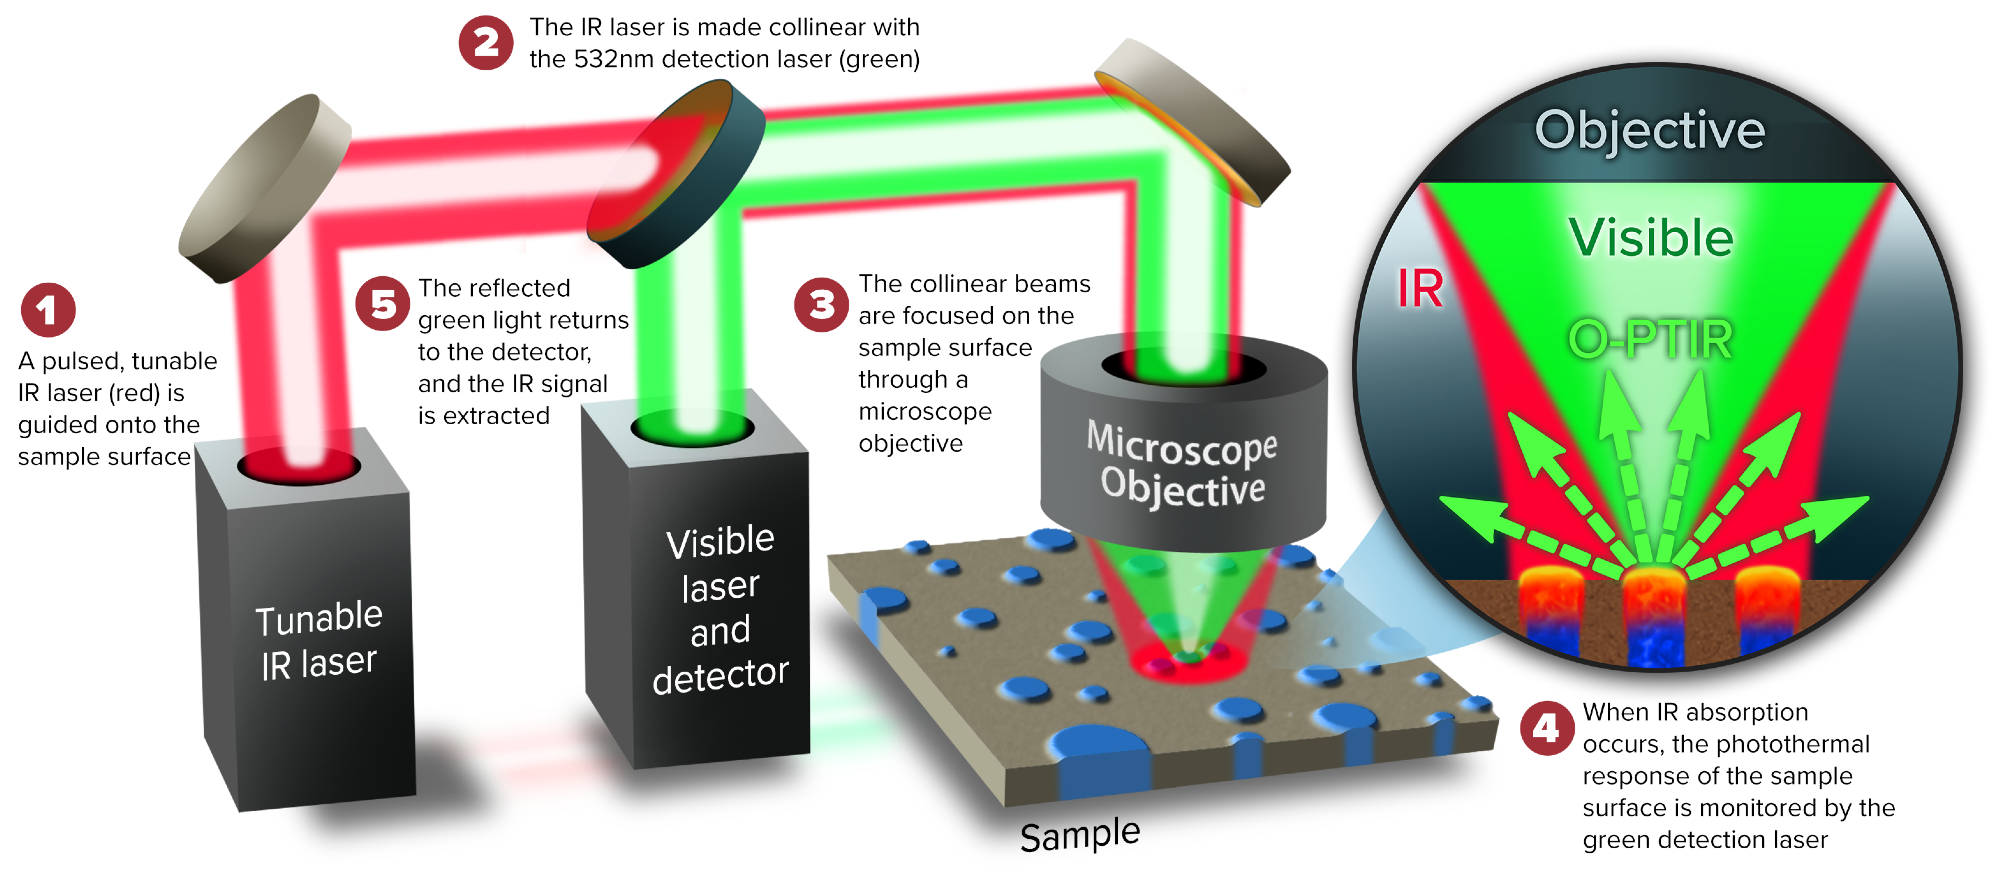
The O-PTIR technique is indirect, where we use a quantum cascade laser to excite the sample in the infrared spectrum, but we measure the surface indirectly via a green probe laser beam. This affords a whole host of advantages. It is another way of doing infrared spectroscopy that overcomes many of the traditional issues faced by practitioners in this field for decades. In this interview, I will refer back to these more traditional techniques of FTIR and QCL.
What are the key limitations of traditional IR spectroscopy?
Traditional IR is performed using FTIRs and some of these emerging QCL techniques. They are limited because they only use long infrared wavelengths. As long wavelengths are used, the primary limitation here is spatial resolution. You can only measure things that are roughly as small as the wavelengths of light used in the mid-infrared region. This is in the order of 10, 15, or 20 microns in practice. And because you’re using a microscope, you’re wanting to look at small things, but you are faced with this wavelength limitation or diffraction limit.
We have overcome this by not measuring with the infrared. We are exciting it with the infrared but probing and detecting via a secondary beam using a green probe laser which is 532nm. It is 20 times smaller than most infrared wavelengths, thus providing a 20x improvement in IR spatial resolution over traditional FTIR/QCL instruments.
This overcomes the spatial resolution limit. Some say it breaks the limits of infrared, but it is just changing the scale of the diffraction limit. Diffraction is still limited to the green spot at about half a micron.
Traditional IR (FTIR/QCL) is very poor in regard to the working reflection mode with poor quality spectra generated. Therefore, users often have to work in transmission mode, so you must thinly section samples, which can be challenging. You often have to work with a contact technique called ATR, but this requires researchers to touch the sample. This introduces contamination issues, risk of damaging the sample and/or the ATR crystal.
O-PTIR works in reflection mode, but the data we generate looks like it has been collected with transmission mode measurement with FTIR. It is fully comparable and compatible with existing FTIR databases.
The other main issue we overcome with traditional IR is dispersive scattering artifacts. Anyone using infrared measured in reflection mode or in transmission mode with tissues and cells will know that these artifacts occur at the edge of the tissues, particulates, or microplastics.
Because the infrared wavelengths are broad and dispersed, they interact differently with various particle shapes, sizes, and surface topology. That means you have this wavelength-dependent scattering effect reflected in the spectra - this is otherwise known as Mie Scattering.
With these traditional techniques, the spectra you generate do not only reflect the chemistry. Often there is a fair bit of sample morphology built into the spectrum that can change how you interpret the spectrum and make traditional spectral interpretation and chemical identification difficult to impossible. The way we do it, we collect IR spectra that do not suffer from any dispersive scattering (Mie Scattering) artifacts and as such, spectra are more repeatable and robust being reflecting of chemistry alone and not sample morphology or particle shape and size.
What are the applications of O-PTIR?
Infrared spectroscopy is one of those workhorse techniques that can be used almost anywhere, but you have got to focus somewhere. Our focus is where our unique advantages are, and that is primarily on life sciences.
We have done well, using the publications area as a yardstick. If anyone visits our website, they will see that there is an excellent trajectory of our publication. This is a good validation of the uptake and its value to academics.
Life sciences, for me, are all about cells and tissues. These could be mammalian cells, eukaryotic cells, or bacteria. Some good work is happening now that we can image and measure IR from individual bacteria. Cells, tissues, and even live cell imaging can be done in water with O-PTIR.
Microplastics is another emerging area, and although it has been around for a while, there is still a lot of public interest and research funding coming into it., Traditional IR is limited to 10 to 20 microns of particle size, whereas with O-PTIR we can go <500nm in size and we can also carry out simultaneous Raman on these tiny particles for a more thorough sample characterization.
The literature tells us that the most biologically relevant, potentially dangerous particle sizes are well below 10 microns, maybe even less than one micron. Now, these are the particles that we can actually uniquely measure. This is now generating much interest in the microplastics research community.
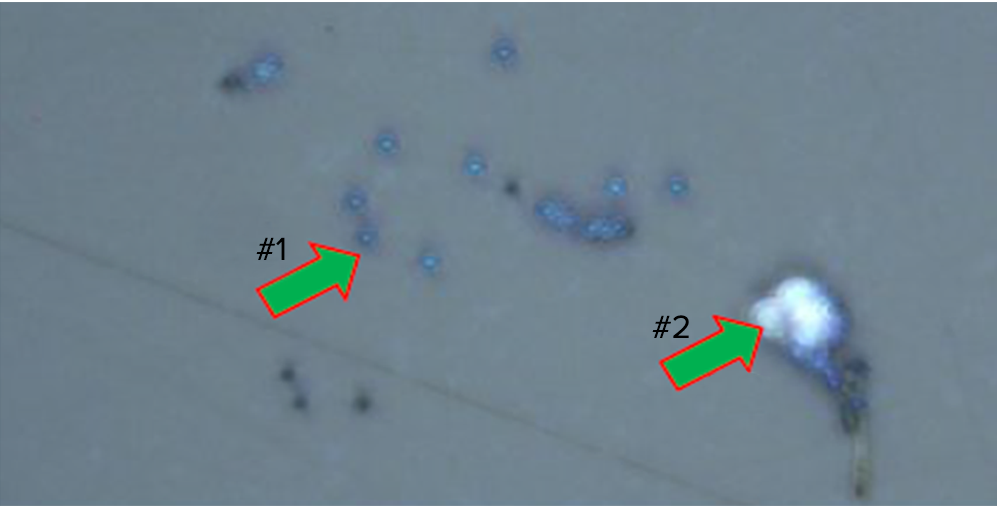
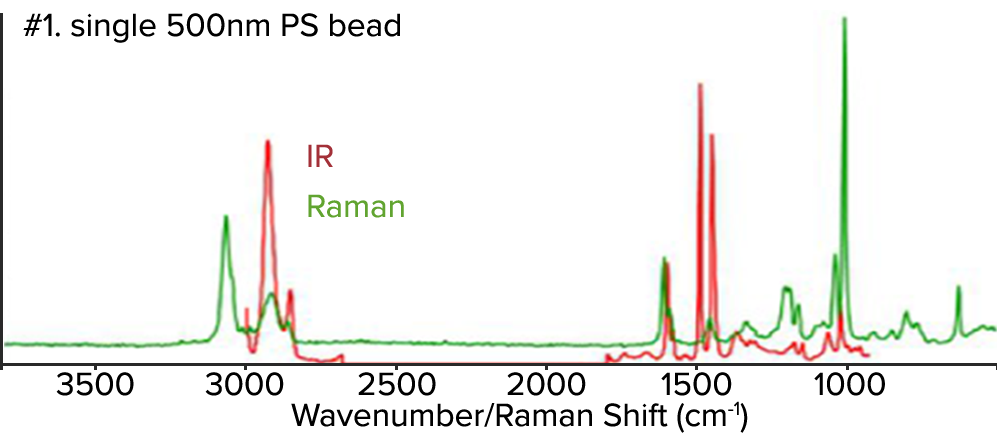
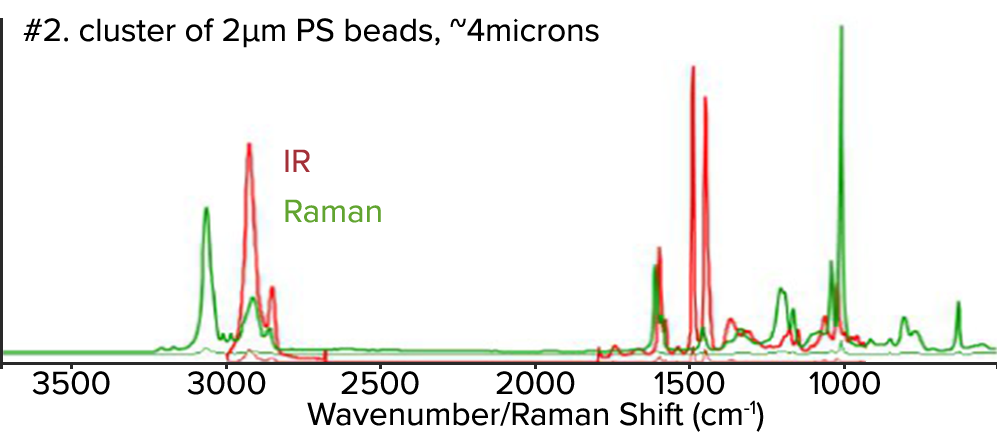
Figure 1: Top, Optical image of various sizes of small PS beads. Middle, The corresponding O-PTIR spectra from a 500nm PS bead. Bottom, Spectra from a 2µm cluster of beads of approximately 4µm in size. The IR spectra from single 500nm bead or a cluster of 2µm beads all look the same. The spectra are raw and unfiltered.
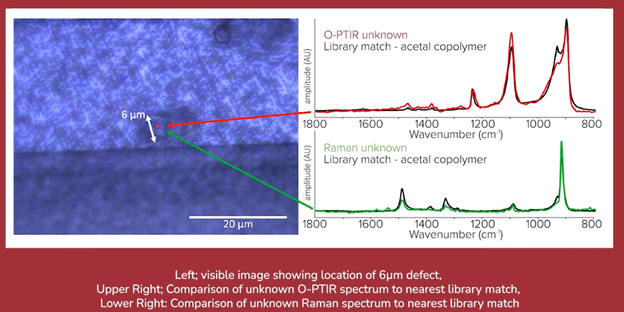
The third is the failure analysis in the semiconductor and electronics space. The black spot that is causing an issue on the production line. The fact that we can go in there and measure it in reflection mode without touching it means we get a high-quality spectra that you can search against existing databases. This goes back to the compatibility of spectra with traditional IR. The spectra we generate are fully compatible.
What advantages does your simultaneous infrared and Raman microscope and imaging system provide?
I call simultaneous IR+Raman the holy grail of vibrational spectroscopy. I am an old-school vibrational FTIR guy. But to this day, sitting there and collecting IR+Raman spectra, seeing infrared and Raman spectra appear simultaneously, is quite impressive.
We teach people that infrared and Raman are complementary. Things that are strong in the infrared are weak in Raman, and vice versa. But these are also confirmatory. This is a big deal in microplastics and even forensics applications, where you often want a backup or secondary technique.
We have partnered with Wiley, where we can search and take infrared and Raman spectra simultaneously, and we use their unique search engine to also search IR and Raman spectra simultaneously. We can now end up with a two-dimensional plot of the infrared hit quality index on one axis, and Raman hit quality index on the other. The upper right-hand quadrant is where the best results are (both high IR and Raman match quality).
What impact will your technologies have on industry and academia alike?
Much work is being done in academia on neurodegenerative diseases, such as Alzheimer's, Parkinson's, Hutchinson's, and so on. These all revolve around protein misfolding. It turns out that infrared is excellent for working out protein secondary structure and protein misfolding.
Much work has been done to spatially locate where this misfolding is happening and what type of misfolding is happening. In academic space, it is undoubtedly driven by life sciences and a little bit by microplastics.
Regarding industry, it is really about failure analysis and figuring out what those tiny black spots are.
What are the challenges within submicron IR spectroscopy at the moment?
We use a submicron technique, and it is a tiny spot. You have a large image and a large measurement field of view, and the question is, where do we measure? We have tried to make this easy to use by providing guidance to users.
We have been using fluorescence for this purpose. One of the new features we have developed is fluorescence or co-located fluorescence O-PTIR.
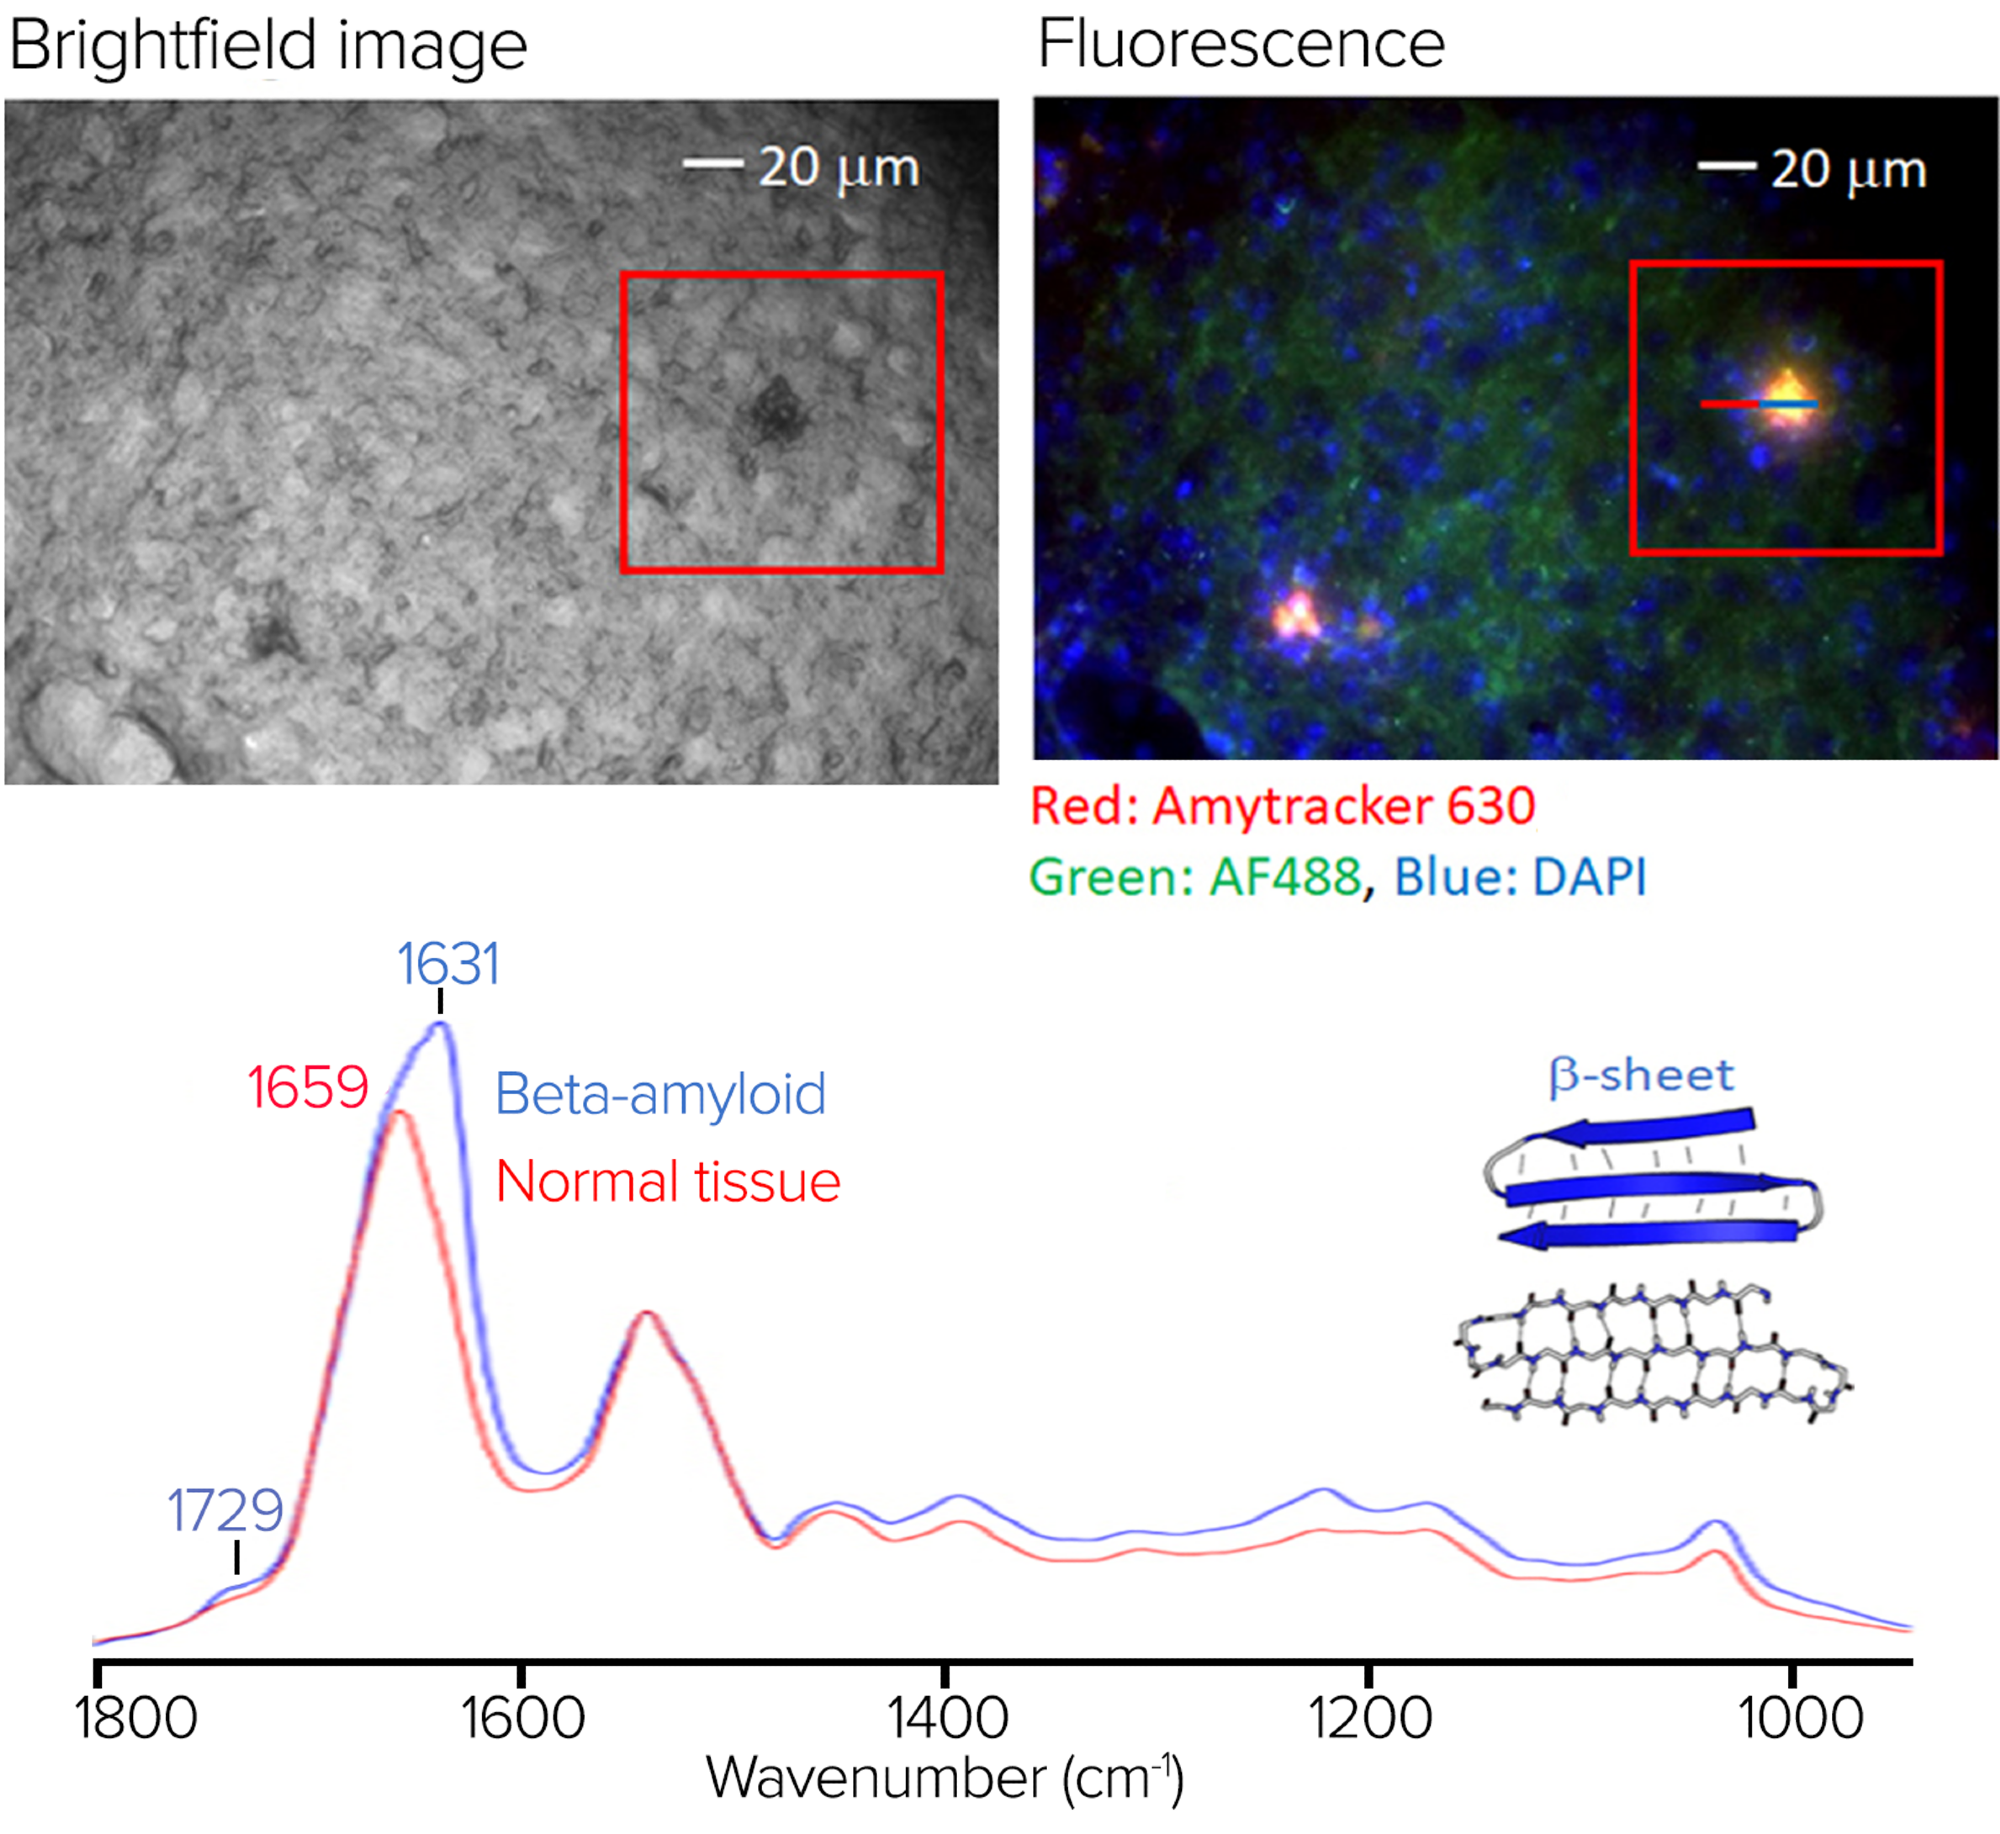
Figure 2: Tissue sammople stained (Amytracker 630) for the presence of beta-amyloid aggregates. Spectra collected on and off the fluorescence hotspots show strong spectral features at 1631cm-1 characteristic of protein beta sheet structures.
Not only are we doing infrared and Raman simultaneously, but we are also doing fluorescence widefield imaging. It has become a true multimodal microscope, where the idea is that the fluorescence image will guide the user as to where to measure the IR. It helps with the old needle in the haystack problem.
With the integration of fluorescence imaging, it has now really aligned itself well with traditional workflows in the life science space as we want to move into life science. The best way to get adopted in the life sciences is to align with what they already do.
You do not want them to change their workflows or change their substrates. We can take exactly what they do today, take the same tissues and cells fluorescently labeled on their glass microscope slides, and put that into our system.
We can generate these beautiful fluorescent images. This could guide you as to where you want to measure. I previously gave the example of neurodegenerative diseases. You can label these proteins as misfolding aggregates and see them in the fluorescence.
This means that, although you cannot see in the visible region, you can go into the infrared and generate the chemical information (like protein secondary structure) that the fluorescence lacks. We wanted to find ways to bring chemical information and add value to the life science researcher. I think this is an excellent synergistic fit.
What are you working on right now that you are particularly excited about?
It is about making the life science transition more manageable and adding value. We are constantly increasing the resolution. We released a new instrument version a few months ago that almost doubled our resolution. We have now gone from submicron to sub-500nm. For anyone in life sciences, this is really useful.
We are continually improving speed and ease of use. With life science being our ultimate goal, we want this to be an easy tool. You should not have to be a spectroscopist, an instrument jock, or a laser jock to be able to work this out. It is very encouraging that we get feedback stating that the software is easy to use.
How is Photothermal Spectroscopy Corp working to overcome the challenges currently within submicron IR spectroscopy?
When it comes to microplastics, all instruments have the challenge of locating the particles and then being able to measure them automatically. This is often a rate-limiting and laborious step.
We will introduce a tool that uses visible images to locate these particles and microplastics. There could be tens or hundreds of them in your field of view. The software will automatically locate these particles and drive the system to these particles. The system will then automatically measure, size, characterize, and identify these particles.
How does it feel to be here at Pittcon 2023 in Philadelphia?
I have been doing this for a long time, and this is my first Pittcon. Over the last 10 or 20 years, I have always heard about Pittcon. For various reasons, I have never managed to get here. But now that I am here, I can see what all the buzz is about. It is a great vibe.
The talks I have attended so far have been scientifically challenging and exciting. We have got our booth and have had some phenomenal traffic. I also look forward to walking around and seeing what others are doing.
About Dr. Mustafa Kansiz
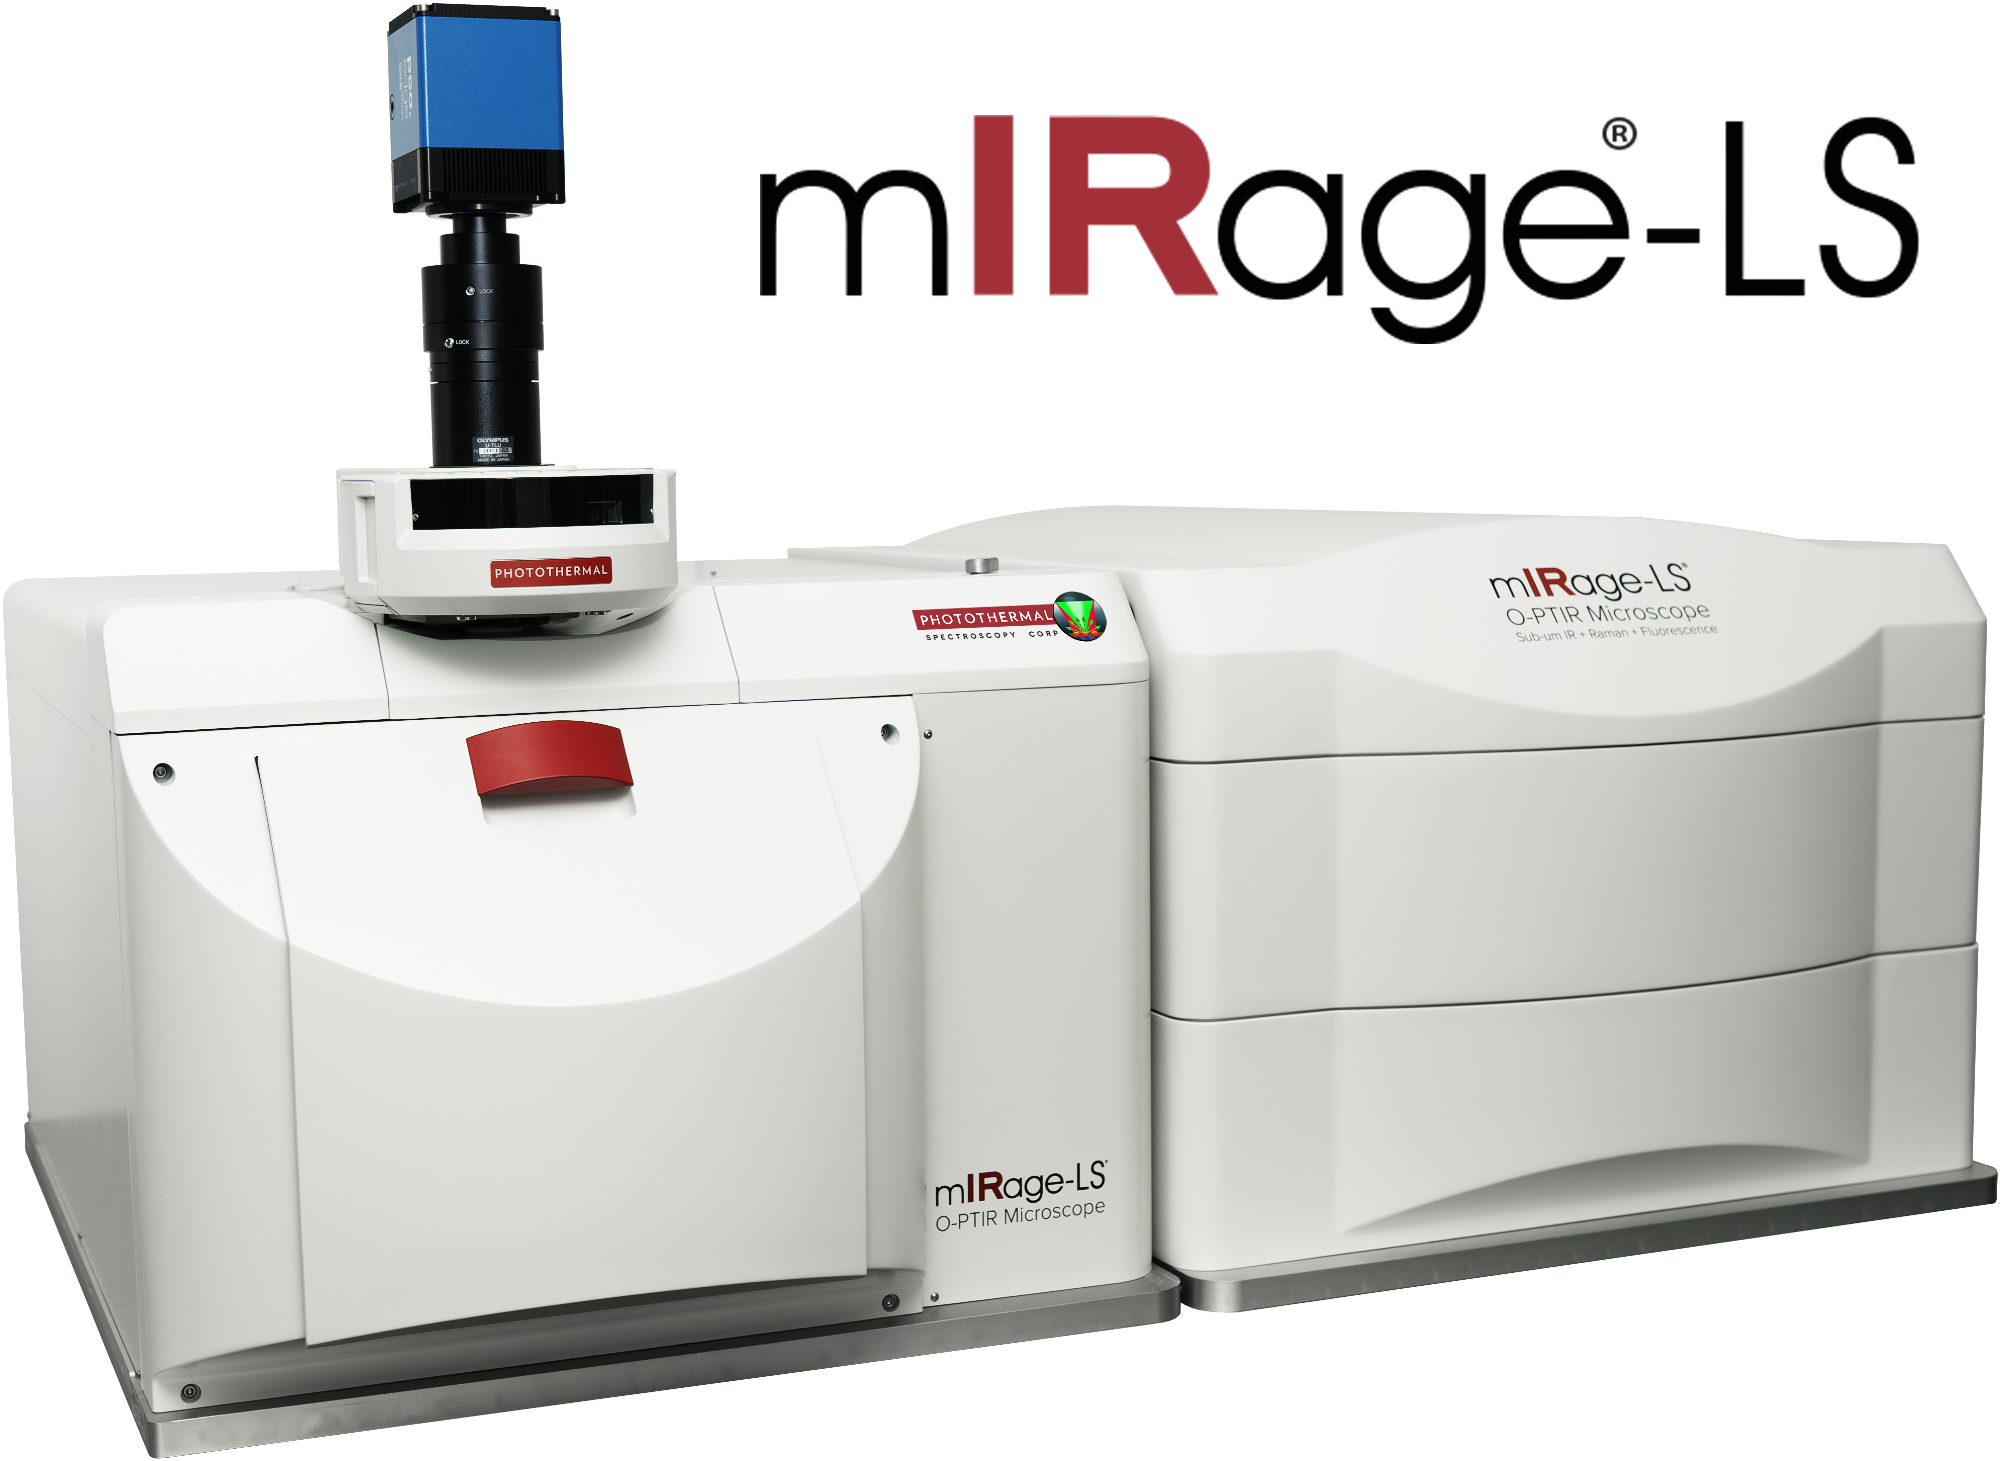
Dr. Mustafa Kansiz is currently the Director of Product Management and Marketing for the mIRage IR Microscope at Photothermal Spectroscopy Corp with responsibilities for new product development, marketing and applications development. He has over 25 years of experience working with FTIR and Raman microscopy/imaging, spanning routine to research applications, in both industry and academia. Throughout his time, he has worked at Varian and Agilent Technologies serving in a range of technical and business roles, including FTIR Microscopy & Imaging Product Manager, Product Specialist, R&D Scientist and European FTIR Sales Manager. He has a PhD from Monash University on biotechnological application of FTIR spectroscopy and multivariate statistics.
This information has been sourced, reviewed and adapted from materials provided by Pittcon.
For more information on this source, please visit Pittcon.
Disclaimer: The views expressed here are those of the interviewee and do not necessarily represent the views of AZoM.com Limited (T/A) AZoNetwork, the owner and operator of this website. This disclaimer forms part of the Terms and Conditions of use of this website.